Product Walkthrough

See what Tenuris actually does

Real screens from the Tenuris app running on a synthetic water treatment plant dataset: 4,218 work orders, 34 assets, 18 technicians, 4 years of history.

Detect Investigate Govern Measure Graph Drift
/01

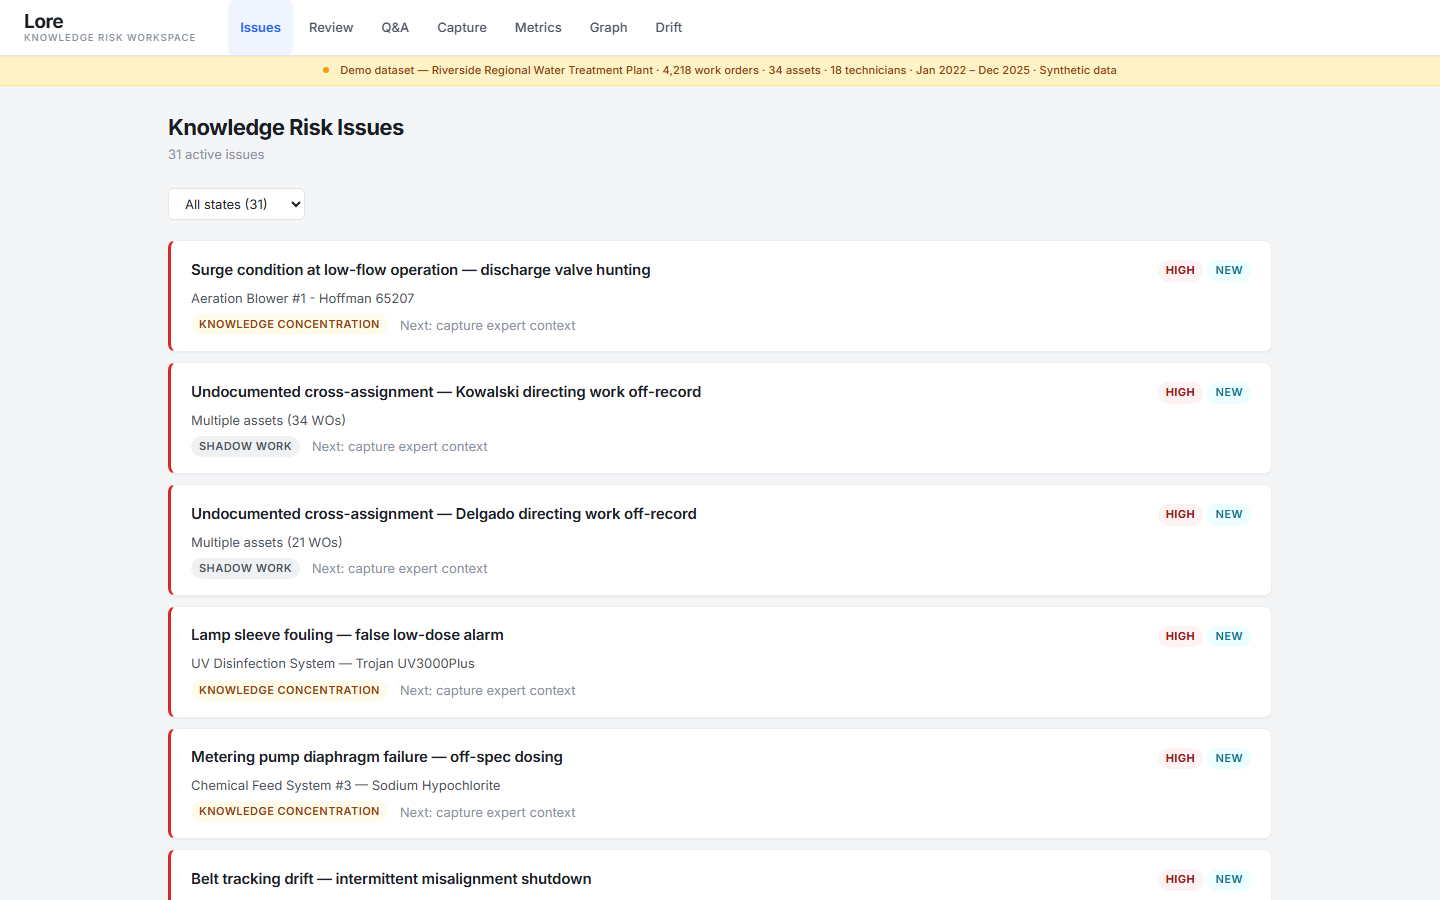
Prioritized issue board

Tenuris ingests a CMMS export and surfaces knowledge risks ranked by severity. Each card shows the failure mode, asset, risk type, and the recommended next step.

31 issues found from 4,218 work orders
localhost:5001 / issues
Tenuris issue board showing 31 prioritized knowledge risk issues
Knowledge concentration and shadow work dominate the top of the board — these are the highest-risk gaps.
/02

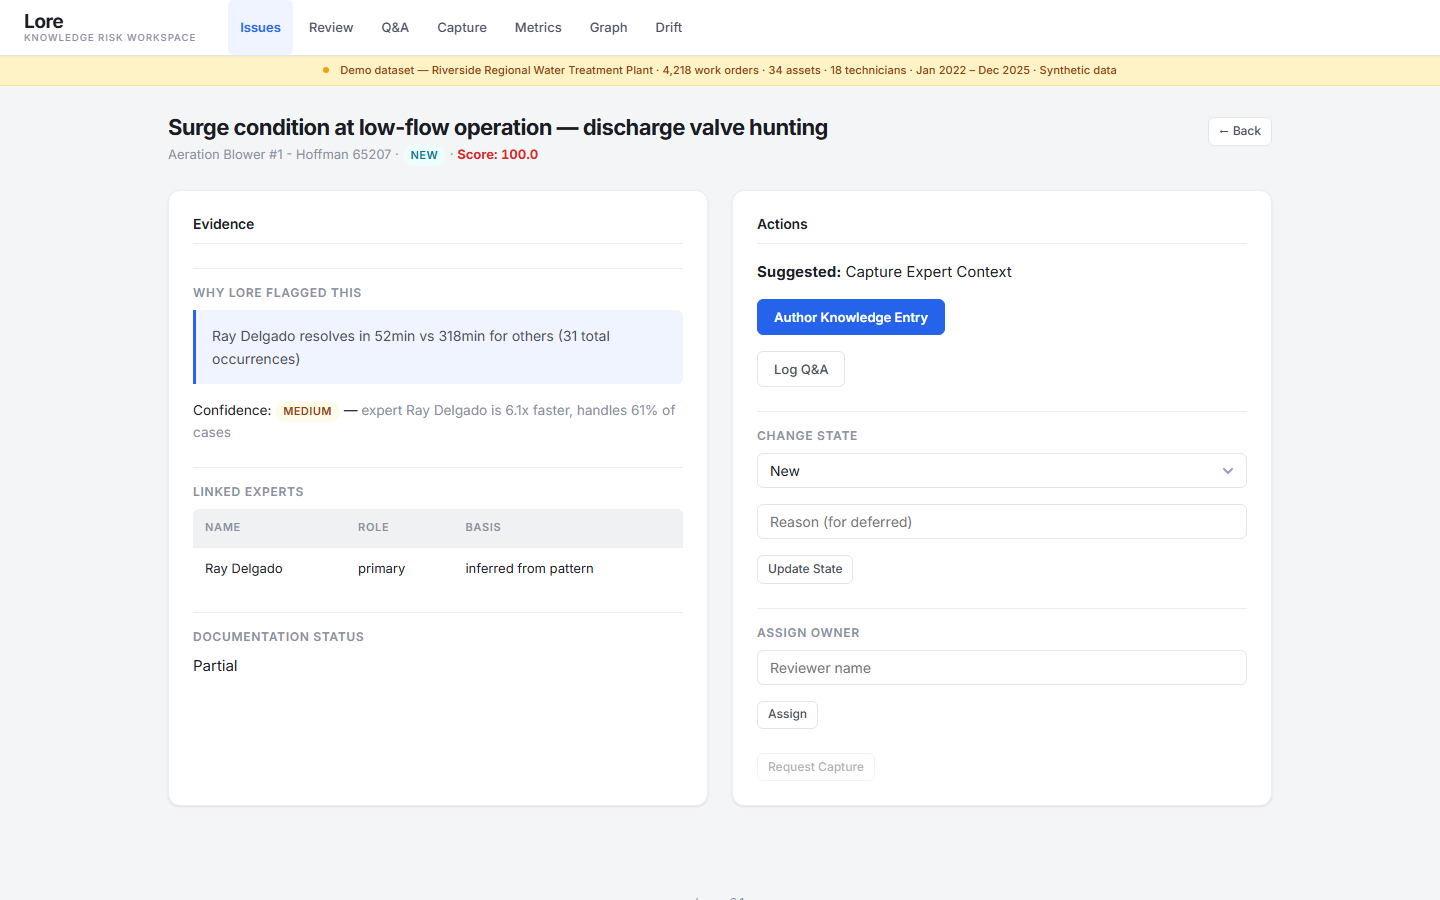
Evidence and actions on every issue

Click into any issue to see why Tenuris flagged it: which expert, how much faster they resolve, confidence level, linked work orders. The action panel suggests what to do next.
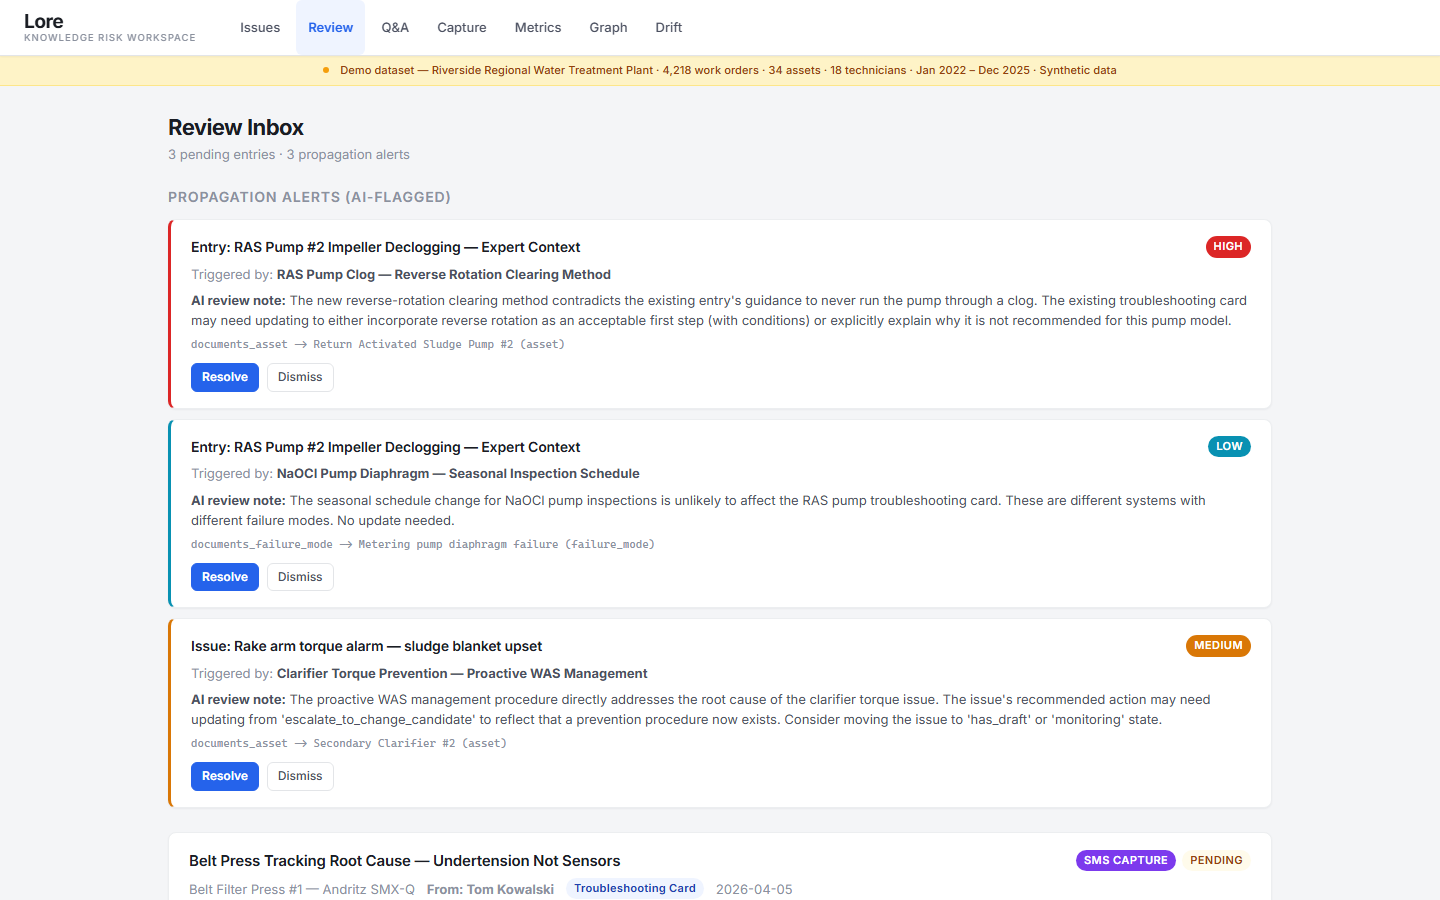
Ray Delgado resolves 6.1x faster than others
localhost:5001 / issues / ISS-2e905dfb
Issue detail showing evidence, linked experts, and suggested actions
Confidence: Medium — inferred from work order patterns. Reviewer can upgrade after verifying with the expert.
/03

Reviewer governance

Nothing becomes operational guidance without human sign-off. Propagation alerts flag contradictions. Pending entries show AI-structured drafts ready for approval, edit, or rejection.

3 propagation alerts + 3 entries pending review
localhost:5001 / review
Review inbox with propagation alerts and pending knowledge entries
Propagation alerts catch when new knowledge contradicts existing entries — reviewers resolve the conflict, not the AI.
/04

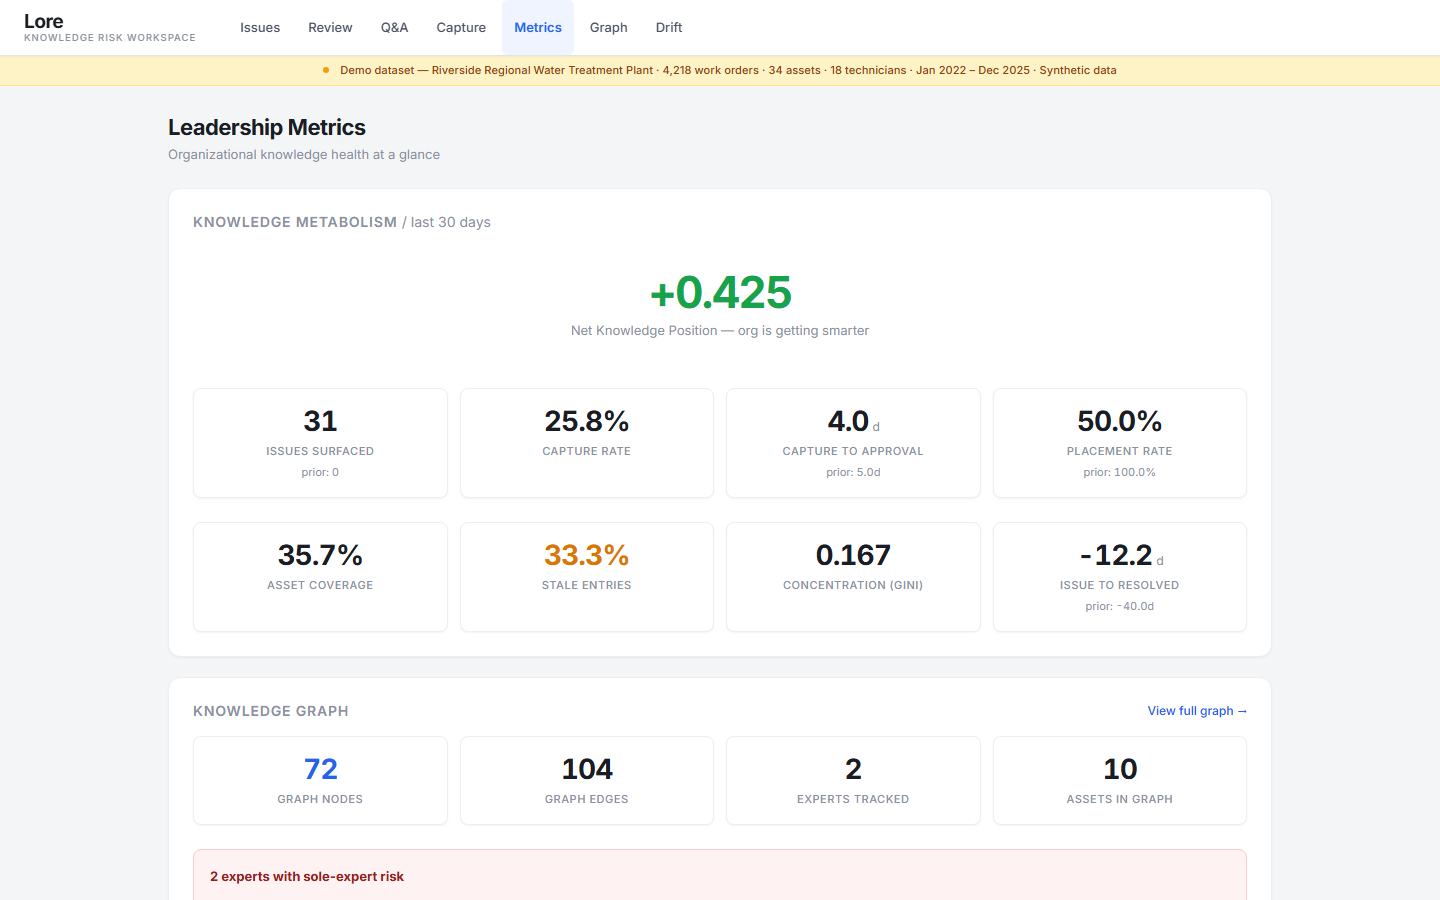
Leadership health metrics

Is the organization getting smarter or leaking knowledge? Net knowledge position, capture rate, governance throughput, placement rate, staleness, and expert concentration — one view.
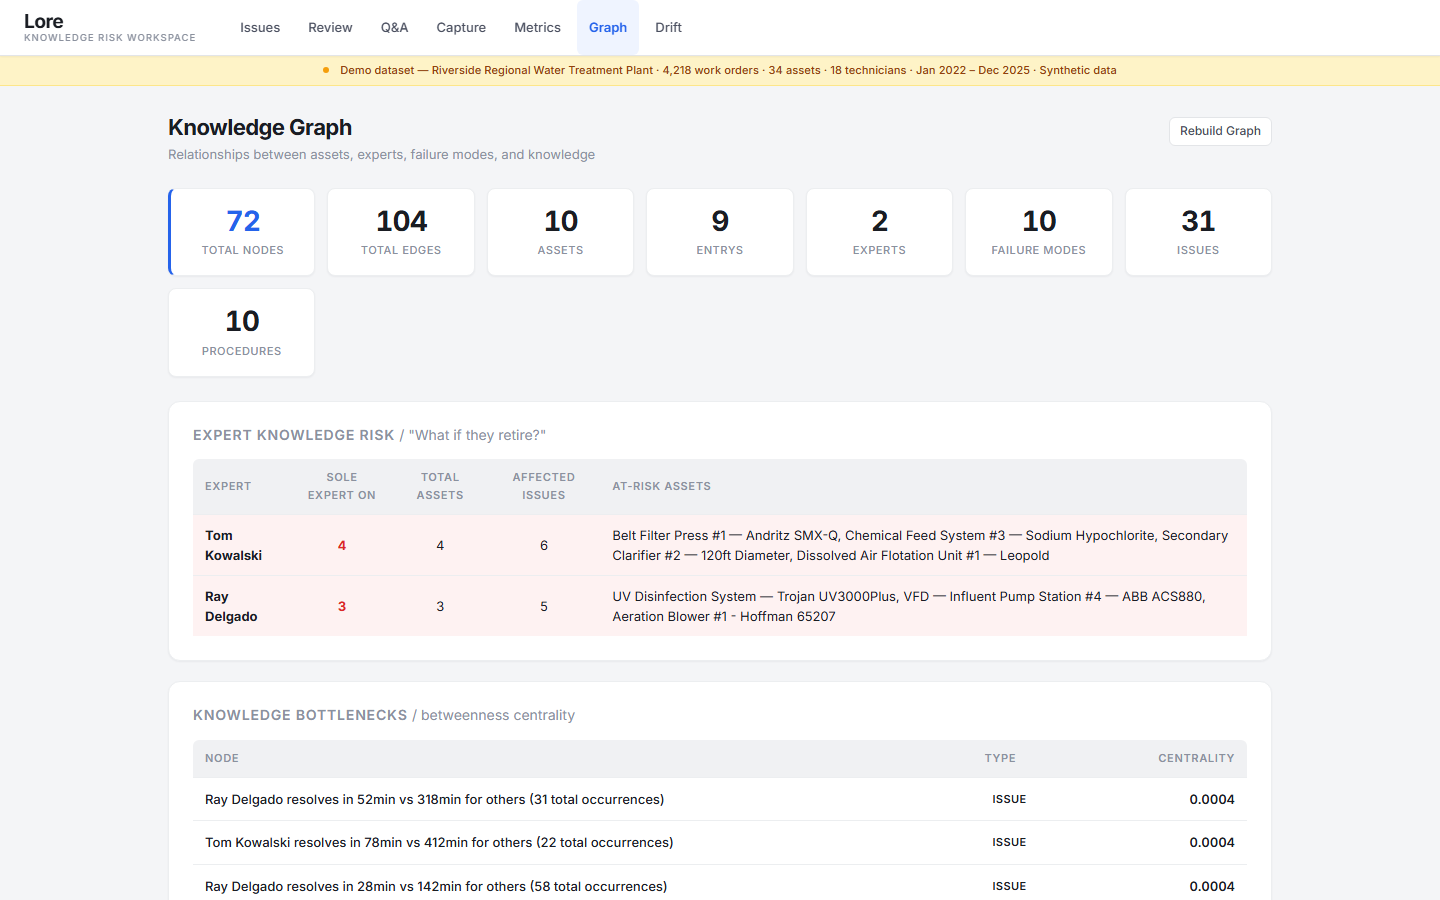
+0.425 net knowledge position — org is getting smarter
localhost:5001 / metrics
Leadership metrics showing knowledge metabolism, graph stats, and pipeline health
Knowledge metabolism tracks whether knowledge moves end-to-end: from detected risk to placed artifact.
/05

Knowledge graph

Assets, experts, failure modes, issues, and entries connected in a relationship structure. The headline: who holds concentrated knowledge, and what breaks if they leave?

Tom Kowalski: sole expert on 4 critical assets
localhost:5001 / graph
Knowledge graph showing expert risk, sole-expert assets, and bottleneck nodes
"What if they retire?" — Tom Kowalski is sole expert on Belt Press, Chemical Feed, Clarifier, and DAF systems.
/06

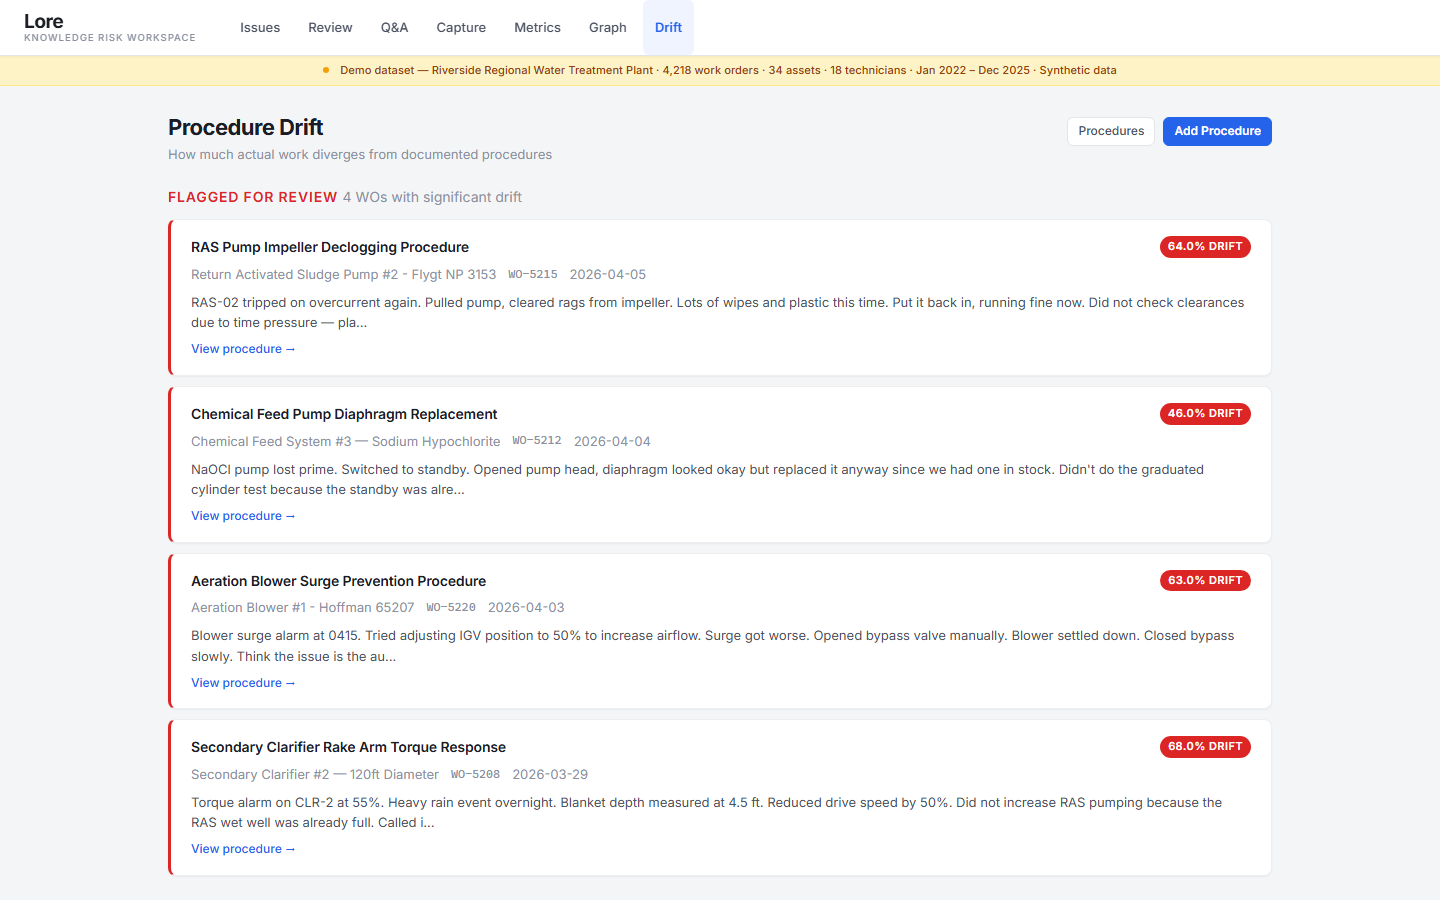
Practice vs. procedure

When technicians describe what they actually did in work orders, Tenuris compares it to the documented procedure. Drift percentages flag where the field story and the book diverge.

64% drift on RAS pump declogging procedure
localhost:5001 / drift
Procedure drift dashboard showing 4 work orders flagged with significant drift percentages
Drift is a governance signal — the reviewer decides whether to update the SOP or retrain to the existing procedure.
4,218
Work orders analyzed
31
Issues surfaced
34
Assets covered
72
Graph nodes

This demo uses a synthetic dataset modeled on a mid-size water treatment plant. 4,218 work orders across 34 assets and 18 technicians, spanning Jan 2022 – Dec 2025. No real client data is shown. Your 48-hour diagnostic uses your data and returns findings specific to your plant.

Run this on your data in 48 hours.

Share a 6-month work order export from one asset area. We return a ranked list of knowledge gaps, concentration risks, and the top issues to act on first — specific to your equipment and team.

Get Free 48-Hour Diagnostic